Report Painter is an easy and effective tool for SAP ERP reporting. This is Report Painter tutorial for beginners. Screen by screen you will learn how to use this tool. When you master the basics, you’re ready to start with your own reports. Avoid reinventing the wheel, use the existing standard reports as models.
1 Report Painter in SAP menu
2 Creating your first report
2.1 Report Design
2.2 Create report (GRR1)
2.3 Main elements of a Report Painter Report
2.4 Row definition
2.4.1 Lead Column
2.4.2 Row 1 – Cost Elements
2.4.2.1 Cost Element interval
2.4.2.2 Set
2.4.2.3 Variable
2.4.2.4 Set Variable
2.5 Column Definition
2.5.1 Key figure with characteristics
2.5.2 Predefined key figure – Actual costs
2.5.3 Predefined key figure – Plan costs
2.5.4 Formula
2.6 General Data Selection
2.7 Save and execute
2.7.1 Report Group
2.7.2 Errors?
2.7.3 New trial
2.8 Add Cost Centers to the report
2.8.1 Cost Centers in Rows
2.8.2 Cost Centers in Columns
2.8.3 Cost Center in General Data Selection
2.8.4 Variation
2.9 Column Heading Texts
2.10 Fiscal Year and Periods
2.11 Add and delete columns
2.11.1 Delete a Column
2.11.2 Insert a Column
2.12 Report title
2.13 Report / report interface
2.13.1 Drilldown to line item reports
2.15 Report Layout
2.15.1 Format Group
2.15.2 Report Layout
2.16 Sections
2.15.1 Create New section
2.16.1.1 Section with characteristics and key fig
2.15.1.2 Section with calculated key figures
3 Main elements of Report Painter
3.1 Library 1VK and Report Table CCSS
3.1.1 Characteristics
3.1.2 Basic Key Figures
3.1.3 Key figures (predefined key figures)
3.2 Create your own library
3.3 Report Group YREP
3.4 Sets and Variables
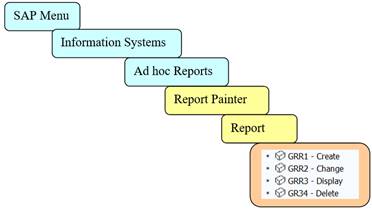
1 Report Painter in SAP menu
You find the Report Painter report from SAP Menu under: Information Systems / Ad hoc Reports/ Report Painter / Report
Or under Controlling / Cost Center Accounting (or Profit Center Accounting) / Information Systems /Tools / Report Painter / Report

Library, Report Group and other important elements of Report Painter are under Report Writer menu.
In which system or client you should do your exercise? If your Company has Sandbox client, use it. Otherwise use the test system.
2 Creating your first report
2.1 Report Design
Before jumping into Report Painter, spend a while planning your report.
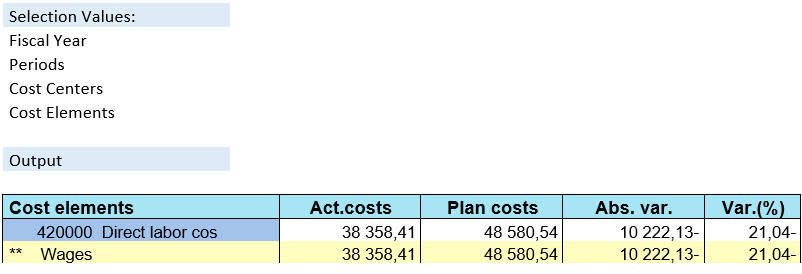
We want to create a simple actual vs. plan cost accounting report.
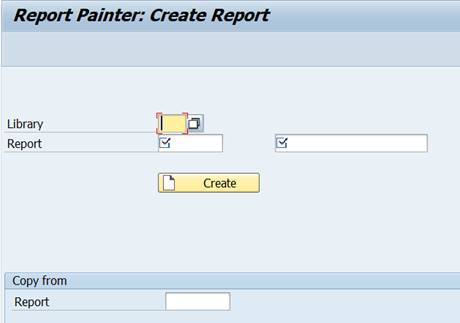
2.2 Create report (GRR1)
Start the Report Painter and select from menu Create Report (or use transaction GRR1).
First you need to enter a library. Use the search help (F4) and open the library view.
Take a closer look at the available libraries. Libraries beginning with a number are SAP standard libraries. You find libraries that contain cost accounting reports (cost centers, orders, projects, product costing), Financial Accounting reports and Logististic information system (LIS) etc.
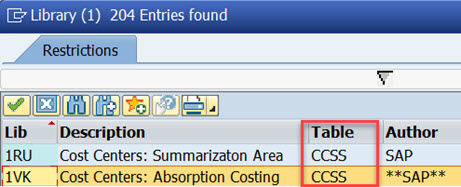
A reporting table is always assigned to the library. This table contains characteristics and key figures that you can use in reports. Examples of characeristis are cost elements, cost centers, periods etc. Key figures are numerical value fields, such as Actual Costs or quantities.
Most SAP standard cost center reports are in library 1VK. Reporting table of 1VK is CCSS.
You can use an existing library or create your own library. Let’s use the library 1VK for our new report.
Give your report an id and description. The name must not start with a number or special character. Start the report name with Z or Y.
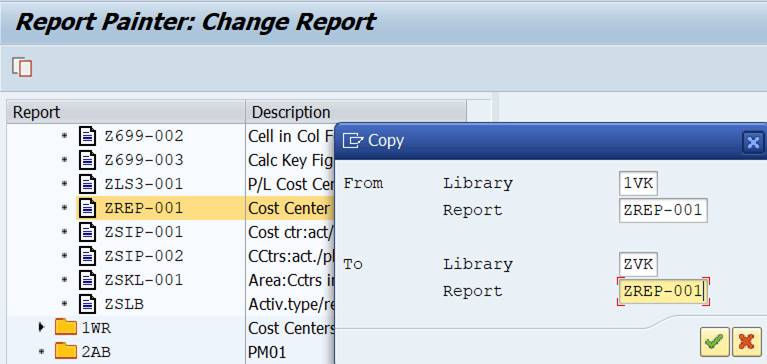
You can also copy the definitions from an existing report.
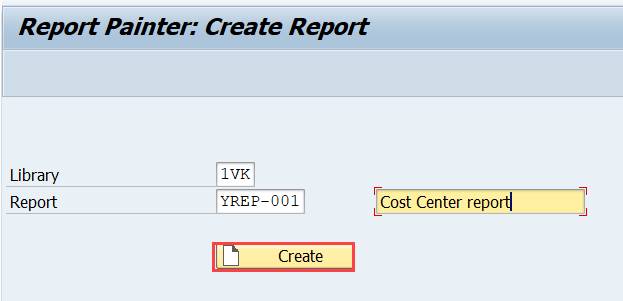
Press CREATE.
2.3 Main elements of a Report Painter Report
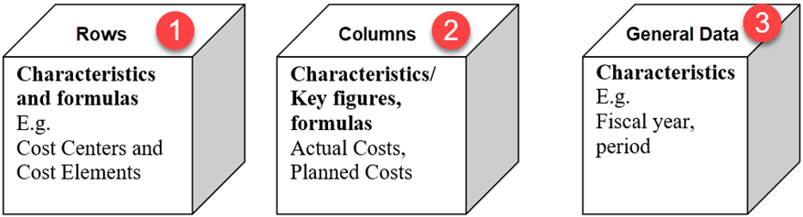
The main elements of every Report Painter report are Rows, Columns and General Data.
Press CREATE.
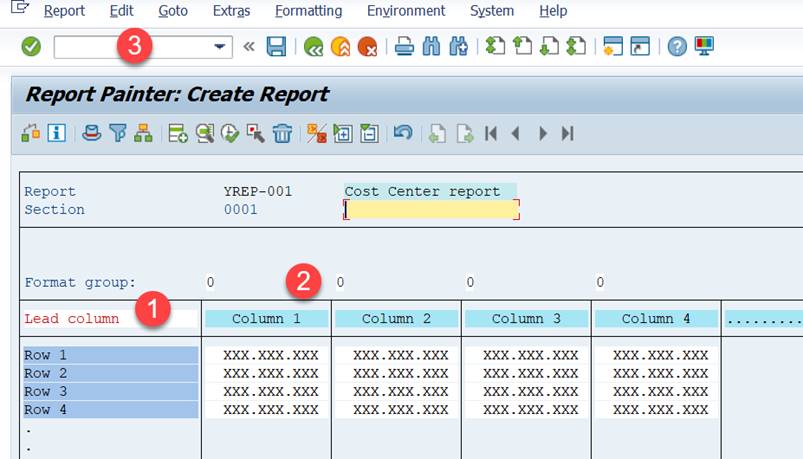
Creating a report begins from an empty report with four rows and columns. You are going to use this report structure as a basis for your own report. It displays the report rows and columns as they will appear in the final report.
2.4 Row definition
2.4.1 Lead Column
Double-click on the ‘Lead Column’ (1) and replace the text with ‘Cost Elements’
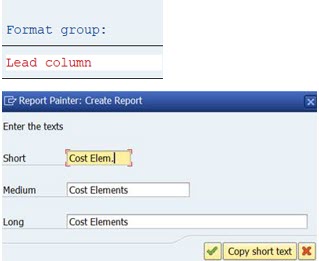
Confirm with enter or green check mark.
2.4.2 Row 1 – Cost Elements
The title of the lead column is now Cost Elements.
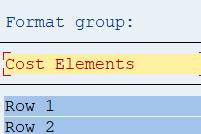
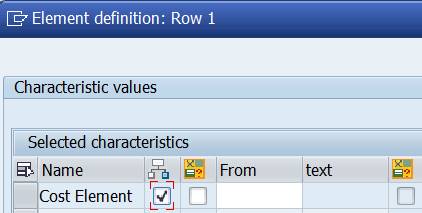
Double-click on Row 1. The Element Definition box opens.
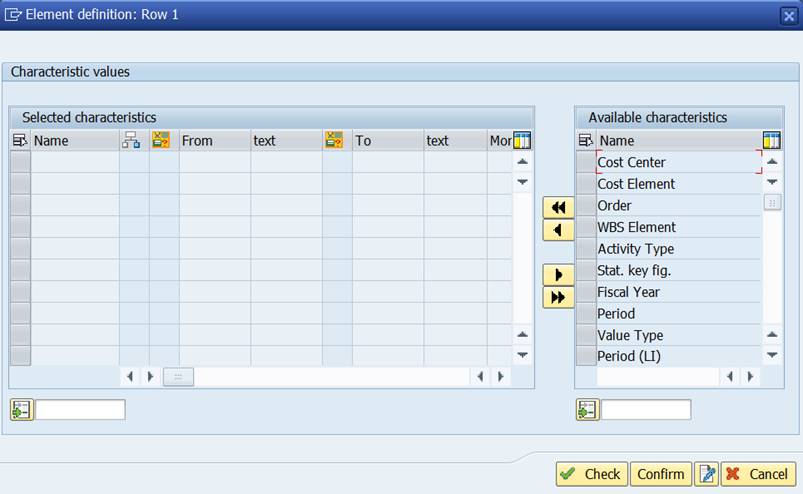
Select Cost Element from the ‘Available characteristics’ and move it to the left.
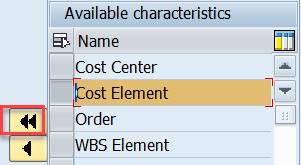
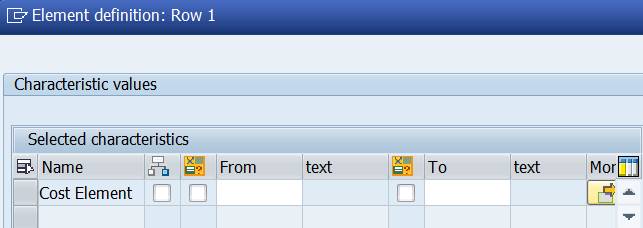
If you try to confirm the selection, you get a message: “Enter a set, a single value or an interval”.

You need to define the cost element values and how they are presented in the report.
There are a couple of options how to do that.
2.4.2.1 Cost Element interval
You can use the actual cost element numbers (single or interval).
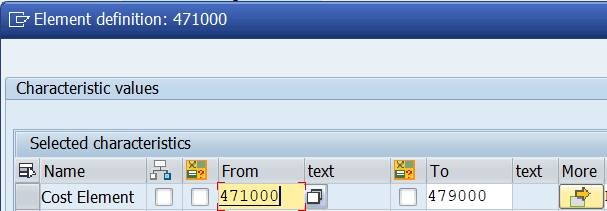
In case you wish to enter several individual values or intervals, press ‘More’ to insert multiple lines. To compress the inserted lines press the ‘More’ with green arrow on the first line.

Scroll to the end of the line. There you can choose how the values are presented in the report. You can choose between No explode, Explode and Single values. In the standard system, the No explode indicator is set as the default.
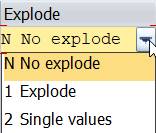
No explode: the values of an interval are summarized to one row.
Explode: the values are singled out and totaled
Single values: cost elements are shown separate with no grand total.
2.4.2.2 Set
Instead of the actual cost elemement values you can use a set. A set is a collection of cost elements. For example, all Cost Element Groups are sets.

Check the ‘Set’ and write the cost cost element group in From. If you don’t know any cost element groups, you can search for them with  (F4)
(F4)
In the ‘Selection of set’ box, click on the small triangle.
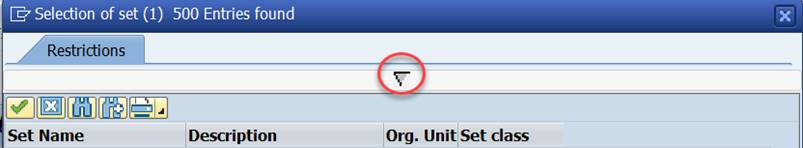
Choose Set Class ‘Cost Elem Grpr’ and enter the name of your Chart of Accounts under Organizational Unit.
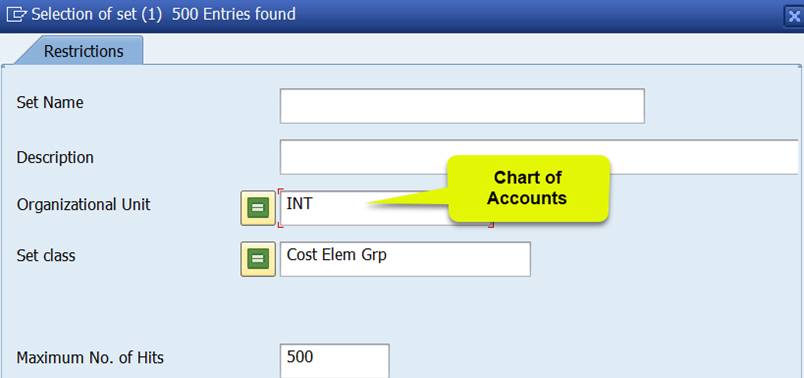
Confirm your choices.
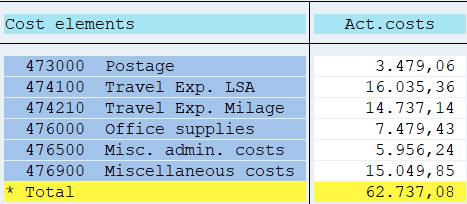
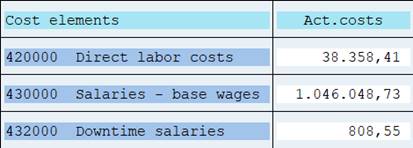
Select the Cost Element Group you want to use in your report. In this example group OAS is chosen.
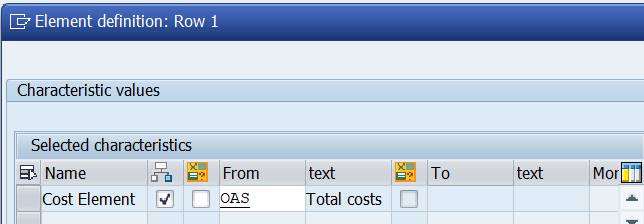
Scroll to end of the line. Choose between No explode, Explode and Single values.
No explode: all the values are totaled to one line.
Explode: the report displays single values, subtotals, and a grand total. The cost element group is exploded and subtotals are calculated based on the hierarchical structure.
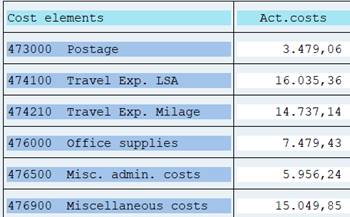
Single Values: the levels of the cost element group are not displayed; only individual cost elements are shown. No grand total.
2.4.2.3 Variable
Next alternative is to use Variables. You can only use variables that are defined in the reporting table of the library.

Reporting table CCSS (the table of our library 1VK) has no variables defined, why this choice is not possible.
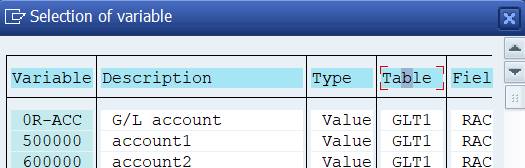
Look for available variables with (F4). Sort By Tables.
2.4.2.4 Set Variable
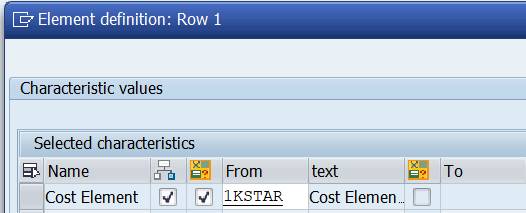
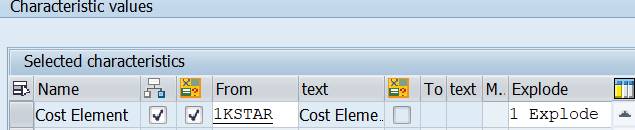
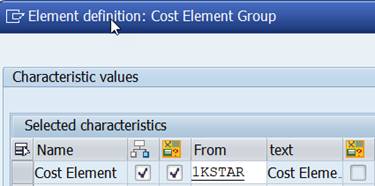
You could not use variables, but you can use something called ‘Set variables’. When you check both the Set and Variable, you indicate that you want to use a Set variable.

There are several ‘Set variables’in table CCSS.
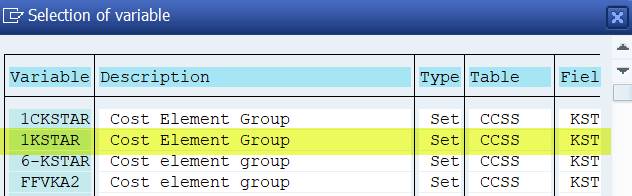
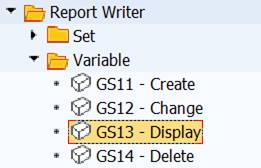
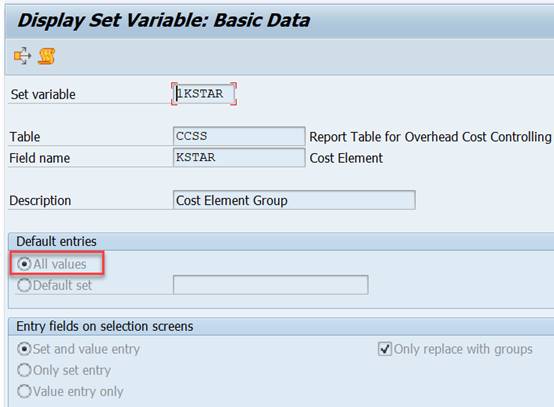
Display variable (transaction GS13).
Set variable 1KSTAR contains all cost elements of the Controlling Area.
Scroll to end of the line. Choose between No explode, Explode and Single values.
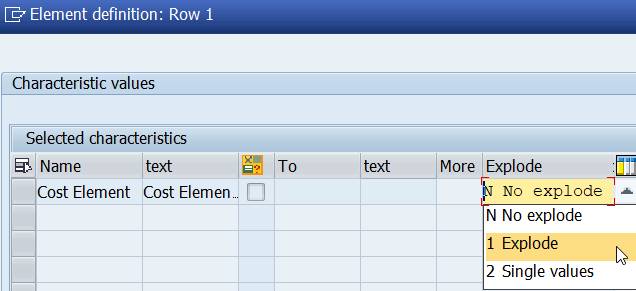
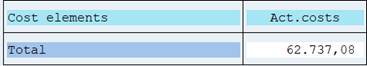
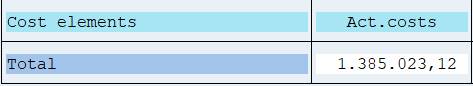
No explode: totals the values to one row.
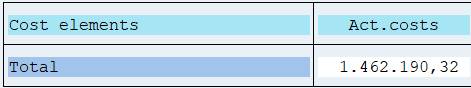
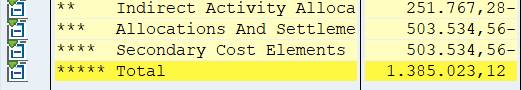
You might wonder why the total value of Actual costs is not the same as above, when we used the cost element group OAS? The explanation is that cost element group OAS does not contain all the cost elements of the Controlling Area, while 1KSTAR does.
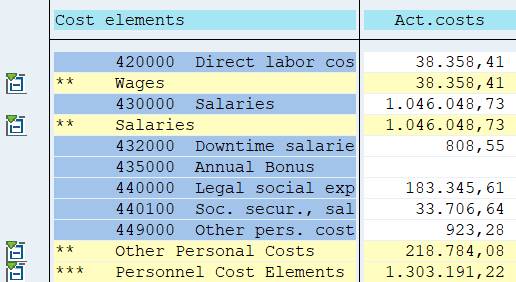
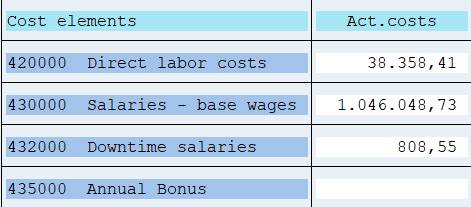
Explode: 1KSTAR explodes only to one level. The report contains all cost elements and a grand total.
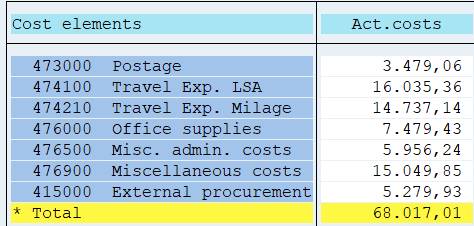
You can replace 1KSTAR with a Cost Element Group in the report selection. In that case, it will be opened.
Single values: cost elements are singled out. No grand total.
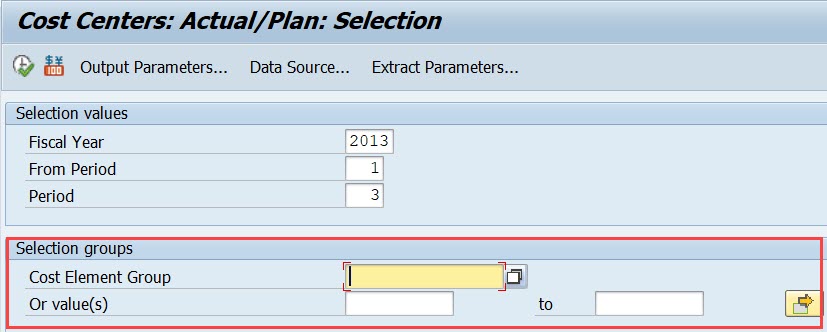
Set variables enable the use of groups, sub-groups and value(s) in the report start. Variable 1KSTAR adds the selection group Cost Element Group or value(s). 1KSTAR has only one level, but you can replace it with any Cost Element group.
In our report we will use the Set variable 1KSTAR for cost elements.
Click on the pen and maintain the default row text.
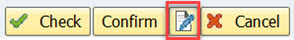
Enter the text: Total Costs.
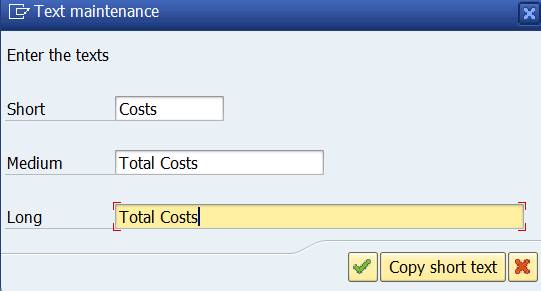
Confirm the entry.
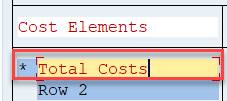
Now you can see the text ‘Total Costs’ and a * before it. It means that, the row contains a one-level group or set.
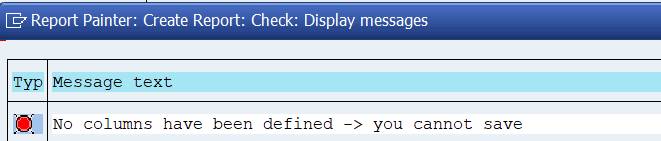
You cannot save the report before at least one column is defined.
2.5 Column Definition
Columns contain a combination of characteristics and basic key figures. You can also use predefined key figures, which contain ready to use combinations defined by SAP.
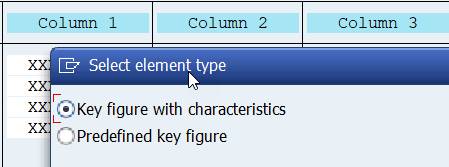
Double-click on Column 1.
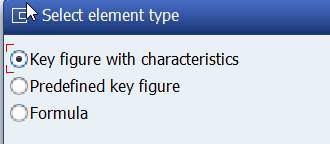
A box with two choices opens.
Let’s take a closer look at both of them.
2.5.1 Key figure with characteristics
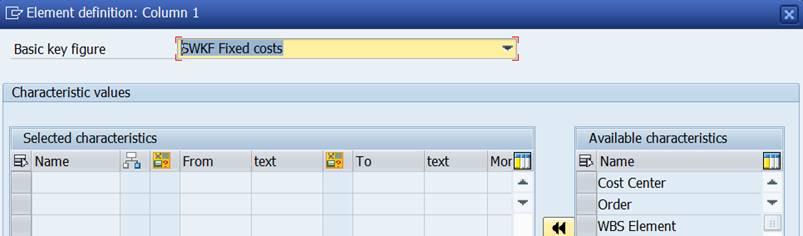
Select first ‘Key figure with characteristics’ and press enter.
Empty Element definition opens. If you are not familiar with Report Painter, you probably don’t know, what to choose.
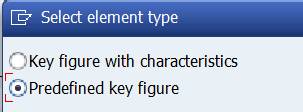
2.5.2 Predefined key figure – Actual costs
Let’s try the second option – Predefined key figure.
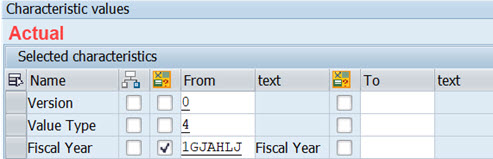
You get at list of choices. Pick ‘Actual Costs in current year’.
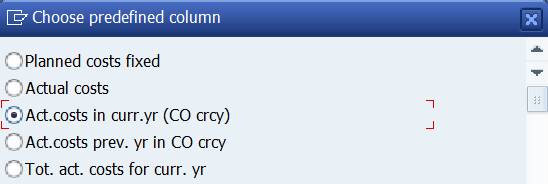
This looks better. The Basic Key figure (SWKG Costs) and characteristics are automatically filled in.
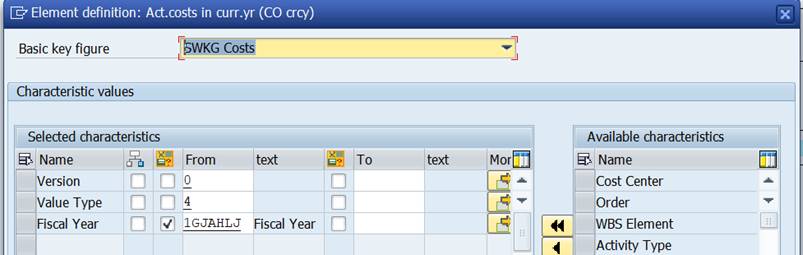
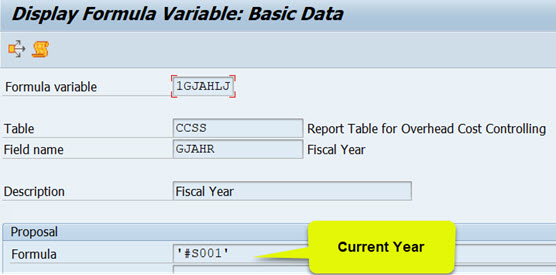
CO version is 0 = plan/actual version, value Type is 4 = Actual, 1GJAHLJ is a formula variant that defaults the current fiscal year.
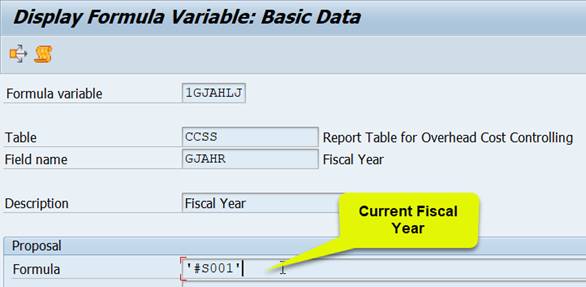
Take a peek at the variable definitions (transaction GS13). The value #S001 in the formula field brings the current year to the variable. If you use a formula variable, you don’t need to maintain the report definition, when the fiscal year changes.
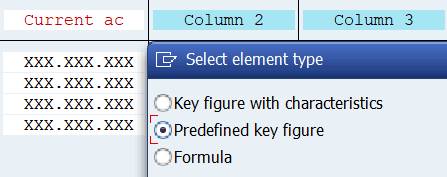
Let’s stick to this choice. Don’t worry about the Column text. We will deal with it later. Double-click next on Column 2. Now there is also a third option ‘Formula’.
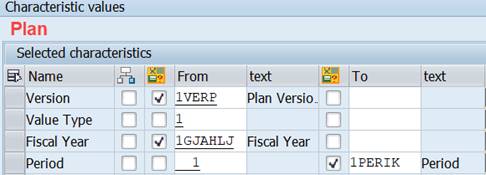
2.5.3 Predefined key figure – Plan costs
In column 2 we want to present the planned costs. Let’s experiment with the Predefined key figures, if we can find something useful there.
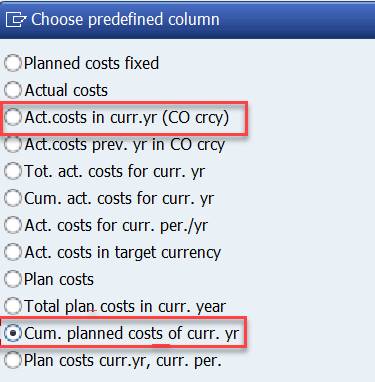
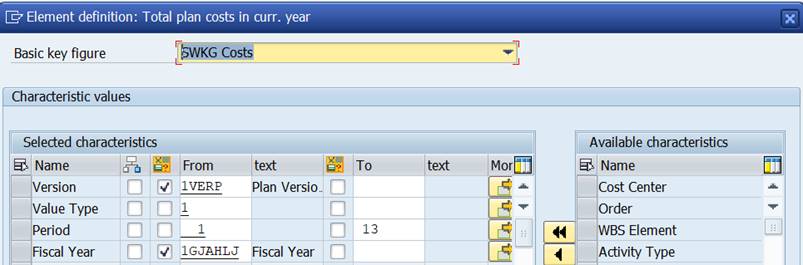
Total plan costs in curr. year brings the plan costs for the total year, for periods 1-13.
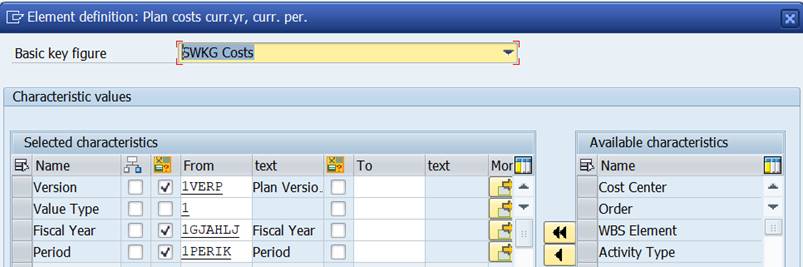
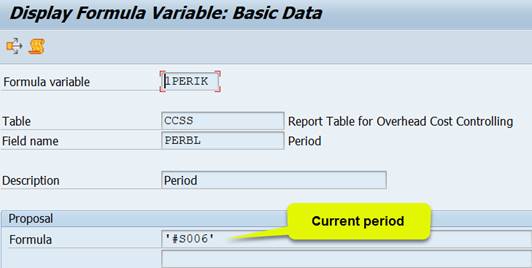
Plan costs, curr. year, curr. period brings the plan costs for the current month (1PERIK)
‘Cumulative planned cost in curr year’ brings the plan costs from the beginning of the year (period 1) to the current period.
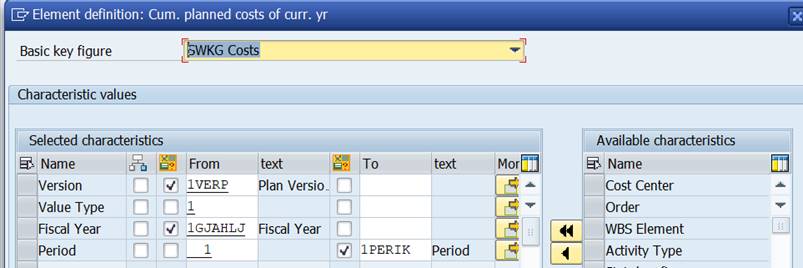
Formula variable 1PERIK contains value ‘#S006’ = current period (check with transaction GS13).
There is no exact match with the actual cost definition. Let’s try the option ‘Cumulative planned cost in curr year’.
2.5.4 Formula
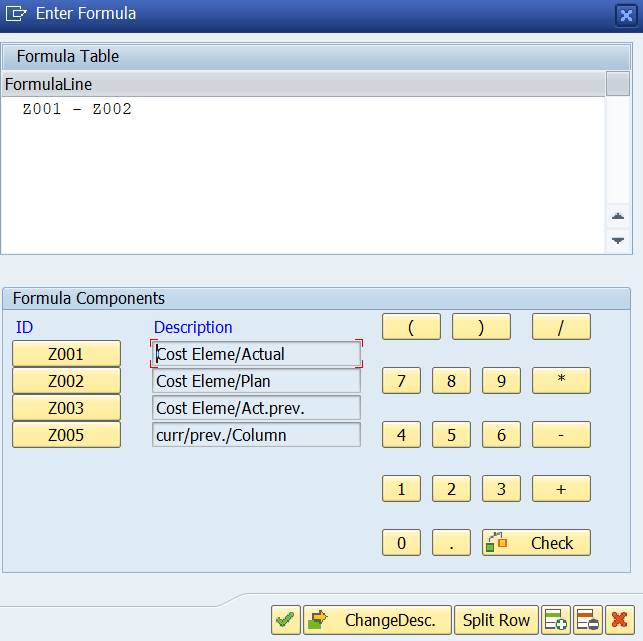
Now we have the actual costs in column 1 and planned costs in column 2. In column 3 we want to show the difference between actual and plan. Double-click on Column 3. Select this time Formula.
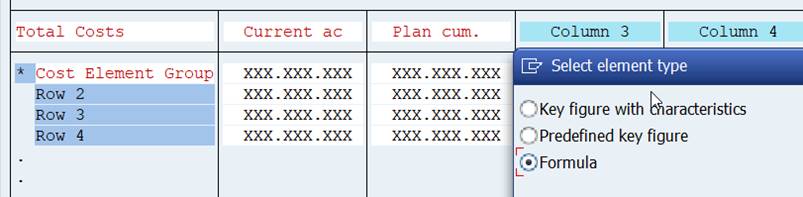
A formula editor opens. In the ‘formula components’ part you see X001 and X002, which are the two columns we just have defined.
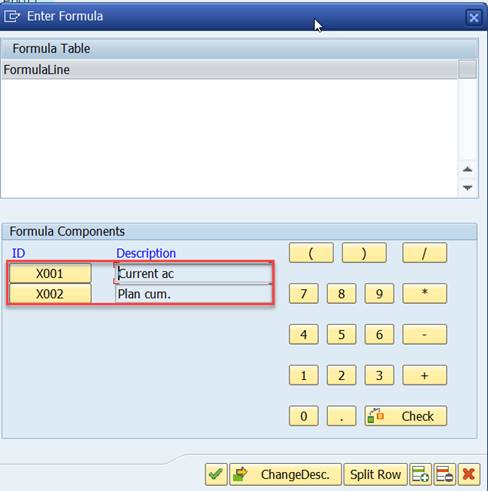
We want the absolute difference of these two columns in Column 3. It is easy. Just type X001-X002 in formula line, or choose the formula elements from formula components.
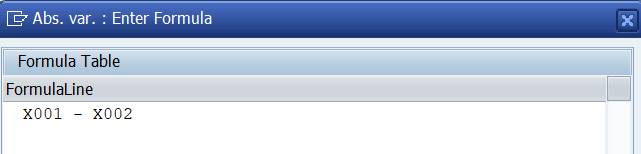
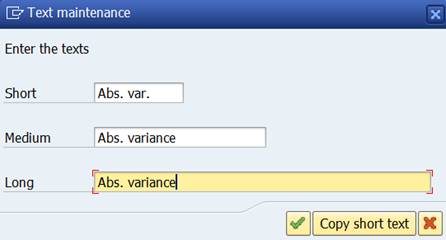
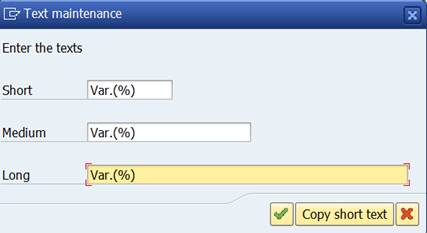
Enter a text.
Now we have the last column left. We want to show here the difference in percentage. Double-click Column 4.
Select Formula and type the formula (x001/x002)*100 or choose the formula elements from formula components..
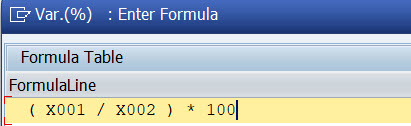
Maintain the text.
This is how our report looks now.
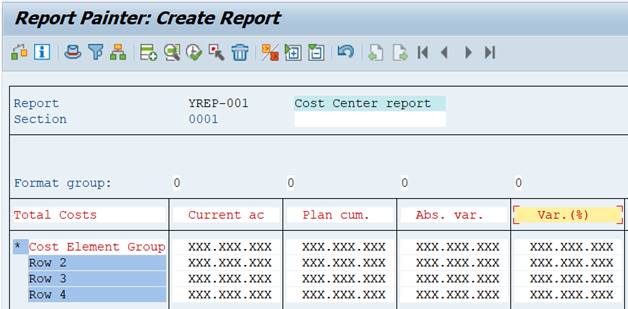
Try to save it. Still something missing. Controlling Area must be specified somewhere.
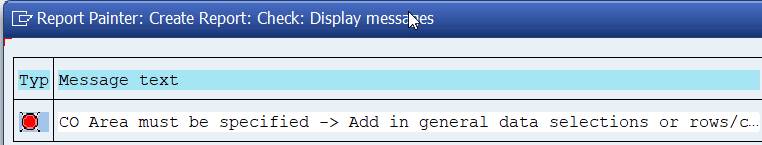
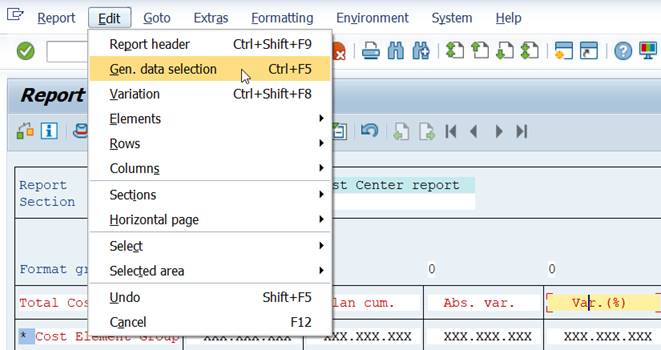
2.6 General Data Selection
Besides rows and columns, we need to maintain General data selection (under the Edit menu). Specify in General data selection all characteristics not needed in report rows or columns .
Empty Element definition opens.
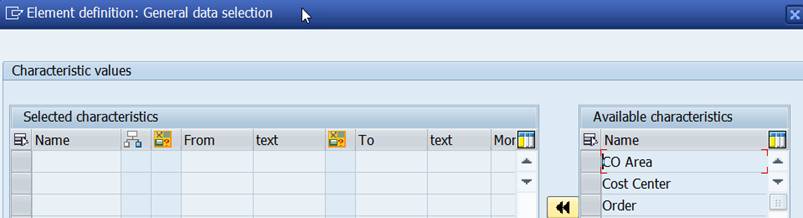
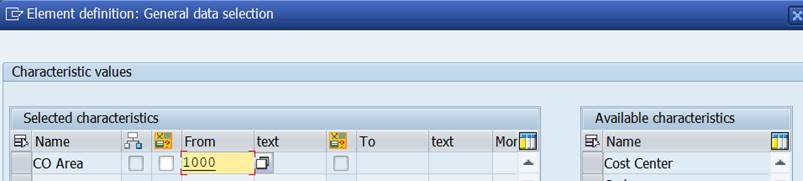
Move CO Area from the right to the left. If your company only has one controlling area, you can put the value here.
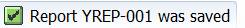
2.7 Save and execute
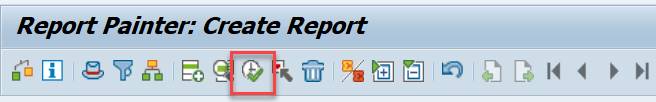
Now you can save the report and take a first look at it.
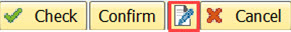
Start with the clock.
2.7.1 Report Group
You get a message on report group. All Painter Reports must be assigned to a Report Group before executing. On initial creation of a report the system will let you create a new report group.
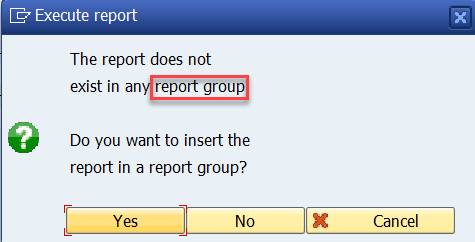
Answer YES.
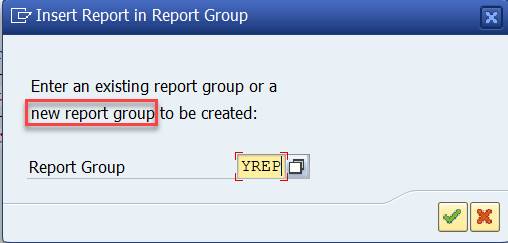
You can put the report in an existing report group, or you can create a new one. Create a report group YREP.
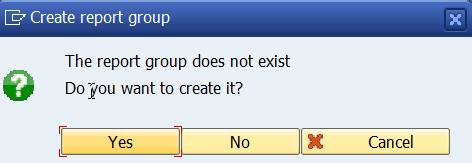
Answer YES and the system will create the Report Group.
2.7.2 Errors?
Successful generation of a Report Group requires that Controlling Area, Fiscal Year and Period all have been correctly defined.
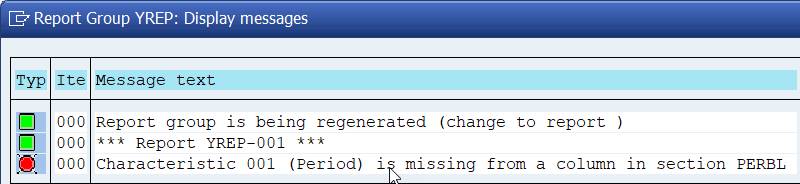
We have defined Controlling area in General data and Fiscal year in Columns. Something is wrong with the characteristics Period.
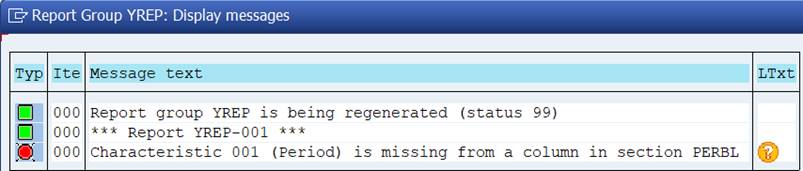
Characteristics Period was used in Plan Costs column.
Actual Costs doesn’t have Period, only Fiscal year is defined.
We need to add the Period also to Actual column.
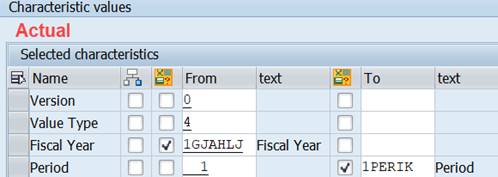
After this correction the system generates the Report Group and the programs necessary to run the report.
2.7.3 New trial
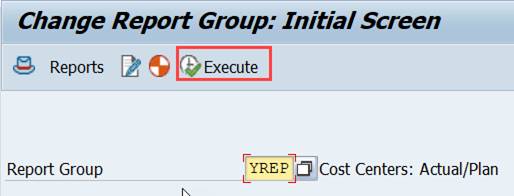
Start the report again with the clock.
This time we pass all the checks and the report selection screen opens.
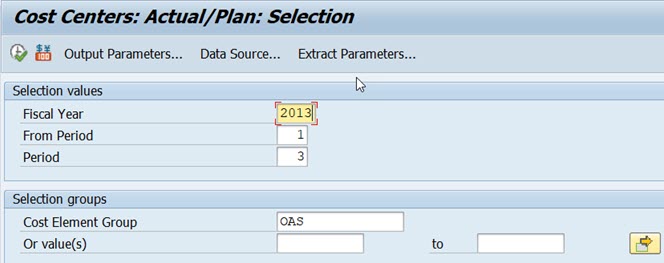
The fiscal year, period and plan version get default values from the used variables. If you are using SAP IDES system, you probably need to change the defaulted fiscal year to an earlier one. I have changed the defaulted 2018 to 2013. The use of Set Variable 1KSTAR for cost elements adds the selection group for cost elements. Select group OAS.
Our first report looks like this.
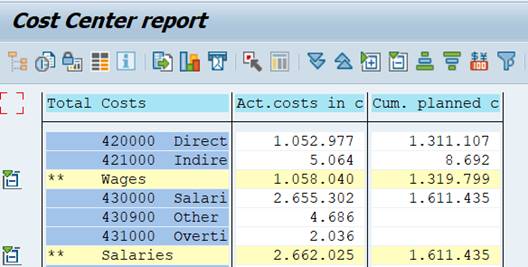
This report displays all the costs of controlling area 1000. To see the costs per cost center, we need to define the cost centers somewhere in the report.
2.8 Add Cost Centers to the report
A characteristic can only appear once either in rows, columns or general data selection. What would be the best place for cost centers?
2.8.1 Cost Centers in Rows
We could add characteristic Cost Center to the row definition. Double-click on row 1. Select Cost Center and move it from the right to the left.
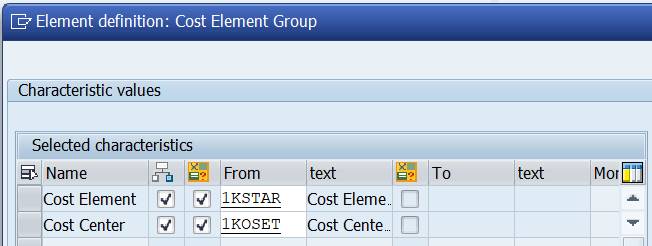
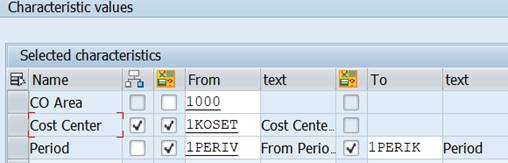
We will use a Set Variable 1KOSET that contains all cost centers.
Choose Explode (at the end of the line) for both Cost Element and Cost Center.
Save the report and execute it.
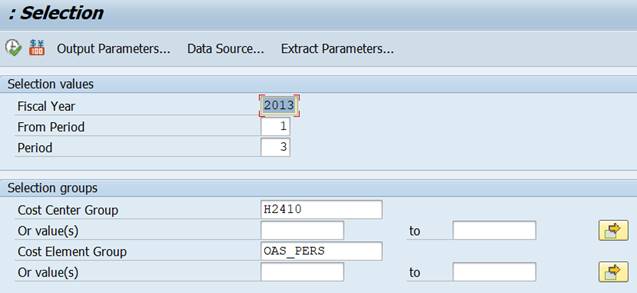
The selection screen has now changed. Cost Center Group or value(s) has been added to the Selection group. The Set variable 1KOSET enabled that.
IDES has very old data, why I change the defaulted fiscal year. The selection is restricted to Cost Center Group H2410 and Cost Element Group OAS_PERS.
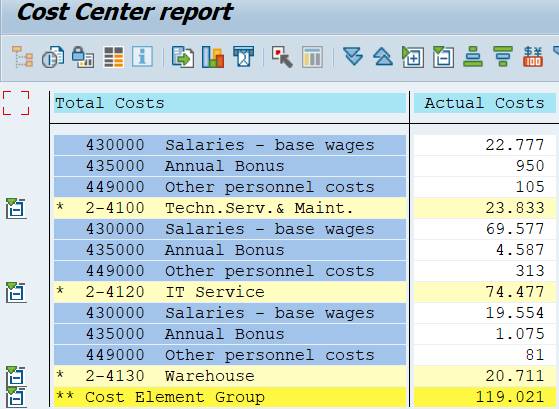
The report lists Cost Centers by Cost Elements. The Cost Element group is exploded with subtotals and a grand total.
Is it possible to change the order?
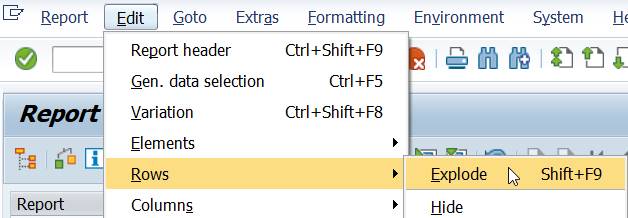
We can change the order of characteristics in the report definition. Select under menu Edit Rows/Explode.
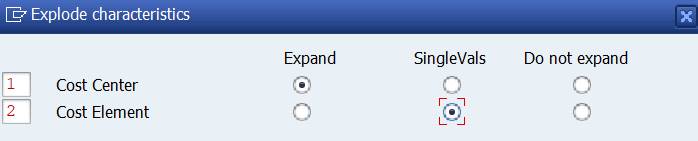
In the Explode Characteristics you see the order of the elements.
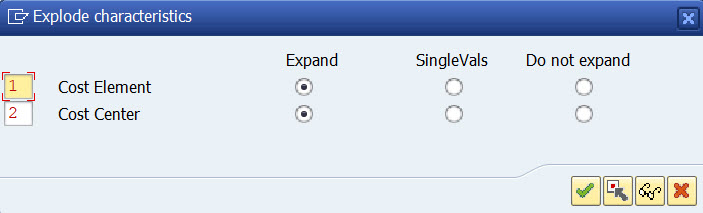
Change the indicator from 2 to 1 for Cost Center.
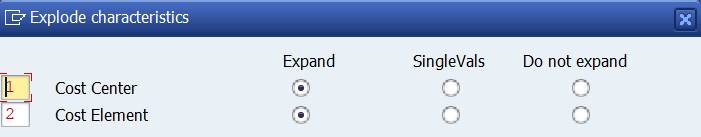
Save and run the report with same selection as above.
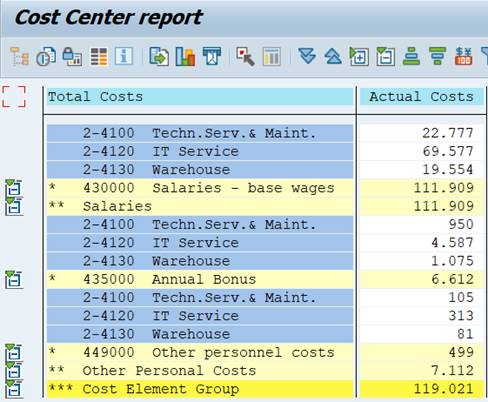
Now we have the report in reverse order.
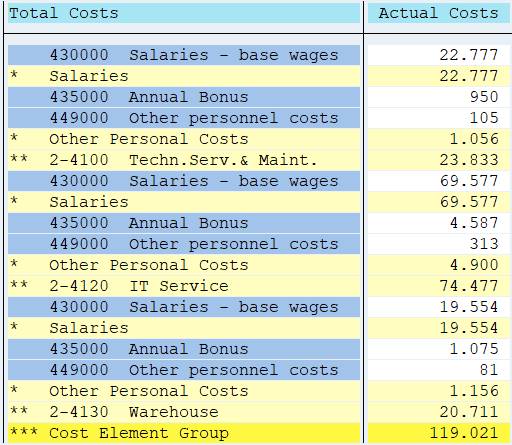
You can experiment with different choices. For example you could choose Single values for Cost Elements.
The report shows then the Cost Elements for each Cost Center without Cost Element hierarchy levels.
2.8.2 Cost Centers in Columns
Columns are used to display key figure values, why the idea of placing characteristic Cost Center there may seem strange.
However, you might want to create a report consisting of a few Cost Centers and their values. You can then define the characteristic Cost Center in each column and use the cost center number as header text.
Double-click on the first column. Move Cost Center to the elemements.
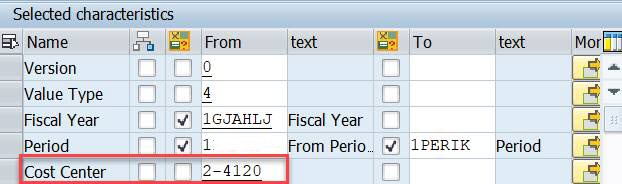
Change the the column heading to Cost Center Name. Save and execute the report.
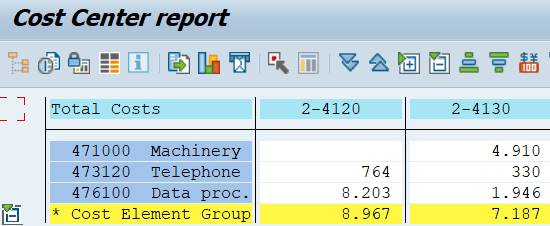
The report looks like this.
2.8.3 Cost Center in General Data Selection
We have still one option. We can specify the characteristics Cost Center in General data selection.
Remove the Cost Center from column definition and add it as a Set Variable 1KOSET to General data selection (under Edit).
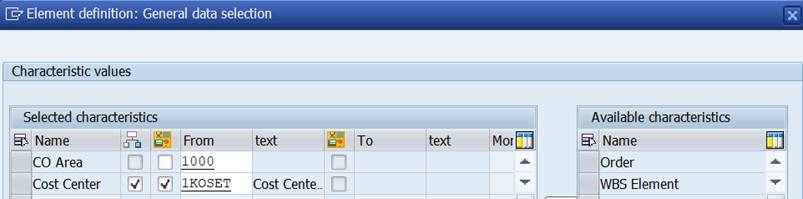
Choose Explode.
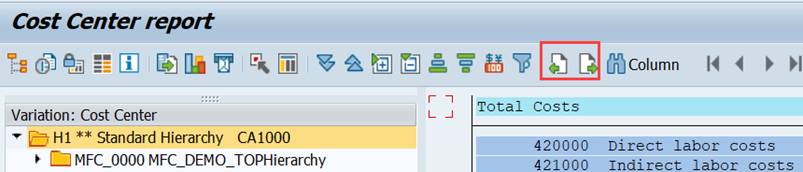
When you run the report, the Cost Center Group opens in the navigation area on the left.
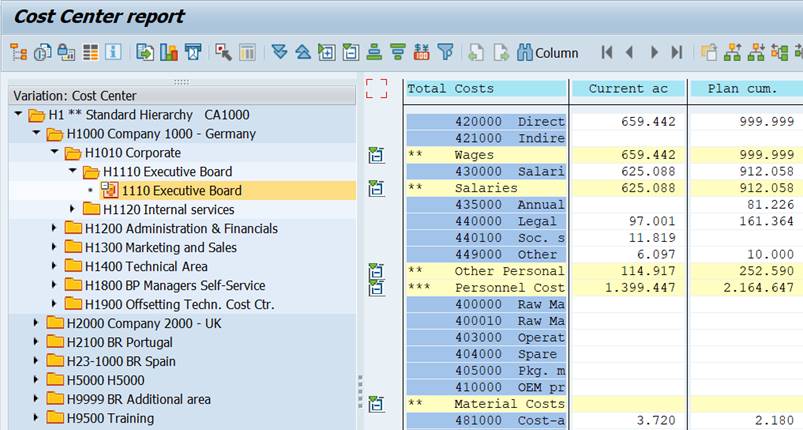
To hide the Navigation Area, click on the Hierarchy Button on the left. The variation buttons on the right allow you to navigate between hierarchy levels.
2.8.4 Variation
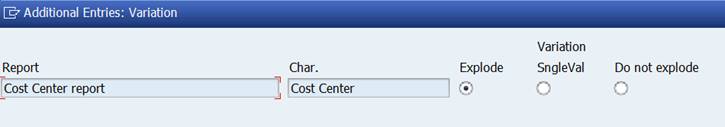
The variation function allows you to print several reports at one go. It is possible to print a report for each element in a group (set) defined in General data selection.
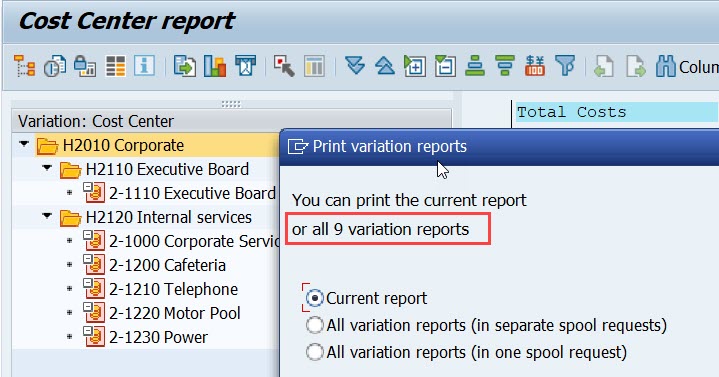
The hierachy in the picture has 3 levels and 6 individual cost centers. When you print, you can choose, whether you want to print the selected level (H2010) or 9 separate reports of all variation levels.
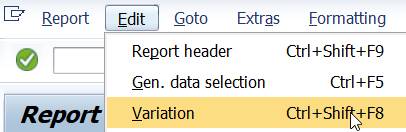
Variation is defined in report definition and is related to General data selections . Characteristics defined as groups (sets) in General data selection show up in variation (menu Edit/Variation).
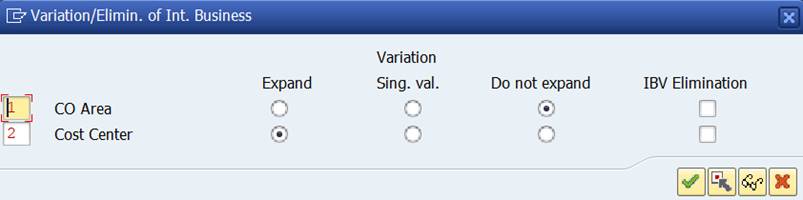
The characteristic Cost Center is expanded, because it was exploded in the General data selection.
If you execute the report in expert mode, you can change the variation setting.
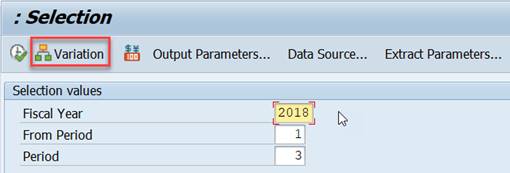
In Expert mode Variation is displayed in report selection.
How to set expert mode:
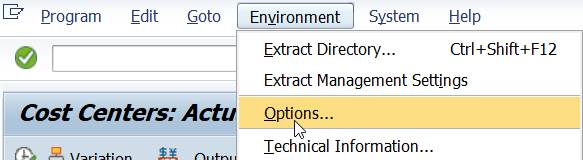
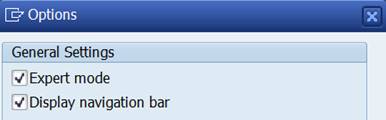
If Expert Mode is not checked, variation is not visible.
2.9 Column Heading Texts
Our report looks now like this. What if you wanted to show the periods in the column headings? This can be done with variables.
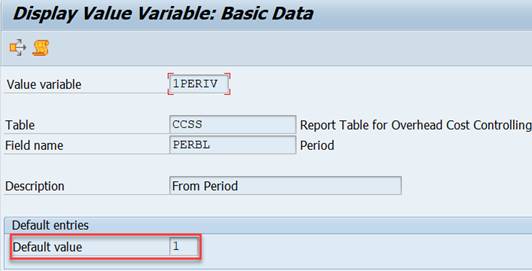
We used element Period in columns 1 and 2 with values 1-1PERIK. Let’s change the From-value from 1 to 1PERIV. The default value of 1PERIV is 1, but the the value of can be changed at report start. Make this change in both columns.
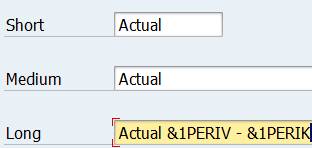
Double-click on the column header and maintain the texts in the Element definition.
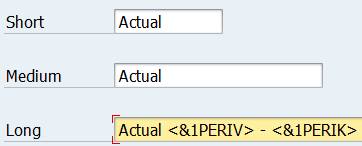
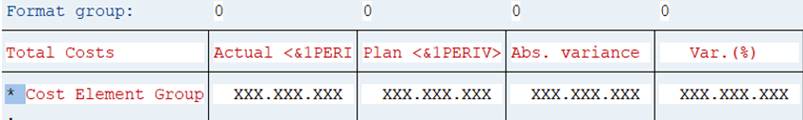
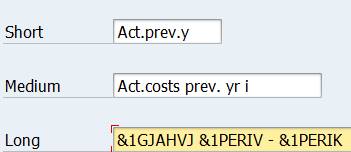
If you want to use the period interval in column text, enter the text in the Long text like this Actual &1PERIV – &1PERIK. It is also possible use arrow heads (Actual <&1PERIV> – <&1PERIK>)
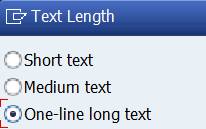
Short text is defaulted, why you need to change the header text lenght to One-line long text.
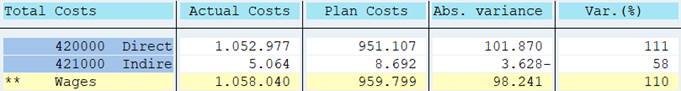
You can now see the variables in column headings.
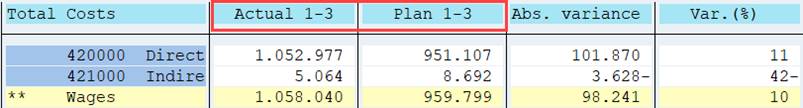
When you execute the report, the variables are replaced with their values.
2.10 Fiscal Year and Periods
So far we have defined Cost Elements in the row, Cost Centers and Controlling Area in General Data selection, Fiscal year and Period in Columns.
Fiscal year and Period interval are in both Actual and Plan columns. We could consider moving them to General data selection. In this report it would be OK, as the values are the same in both columns. For now we will leave the Fiscal year and Period as they are in column definition.
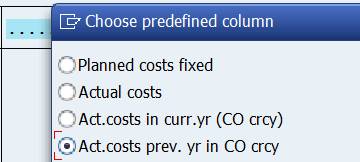
Next we want to add a new column for previous years values. Select the predefined column Act.costs prev.yr. It adds fiscal year but no periods.
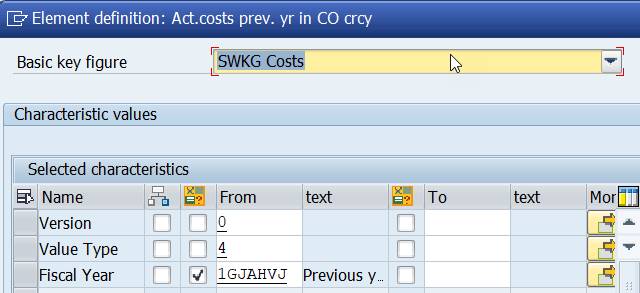
Because of the missing period, we get an error when we try save and to run the report.
We have two alternatives to correct the error:
1. add period definition also to the previous year column
2. move the period definition to General data selection
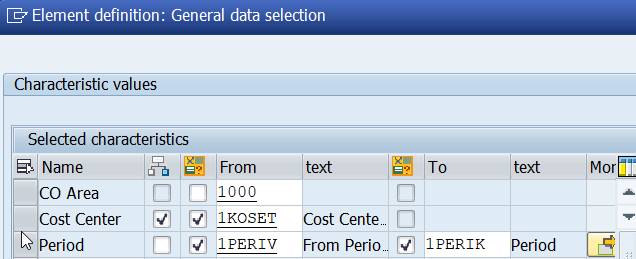
We choose alternative 2. First remove Period from all columns and then add it to General Data. Now it is valid for all columns.
Change the name of the Prev.yr. column heading to &1GJAHVJ &1PERIV – &1PERIK
Run the report.
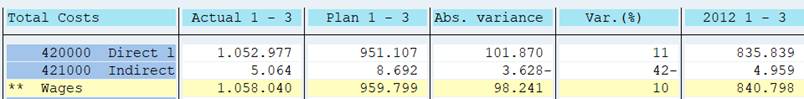
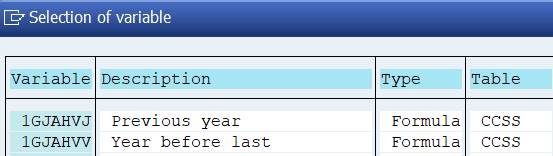
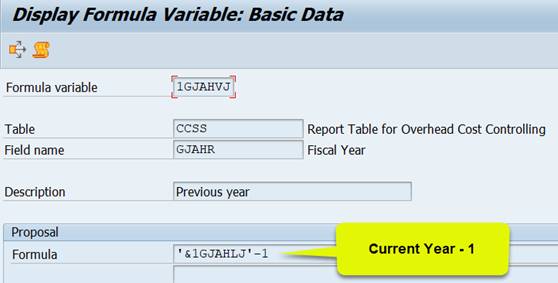
Where did the variable 1GJAHVJ get the value 2012?
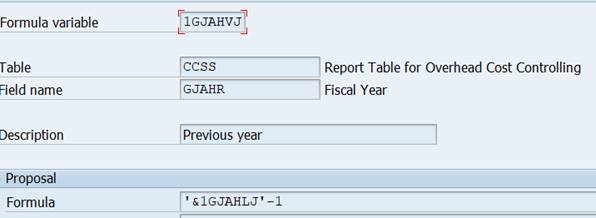
The explanation is found in variable definition (transaction GS13). The 1GJAHVJ is a formula variable with value ‘&1GJAHLJ’-1. Variable 1GJAHLJ contains value ‘#S001’ = current year.
In my example I changed the defaulted current year to 2013, because IDES does not contain current data.
We need to keep the Fiscal year in columns, because it is not the same in all columns.
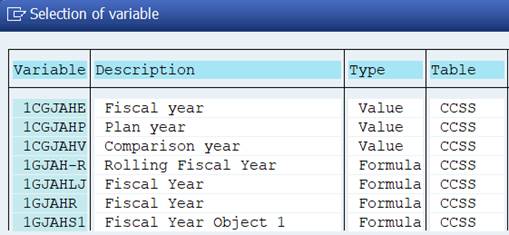
In table CCSS we find several variables for Fiscal year. Does it matter which of them we use? If you check the variable definition (transaction GS13), you find out that several of them default the current year (‘#S001’)
Let’s experiment a little.
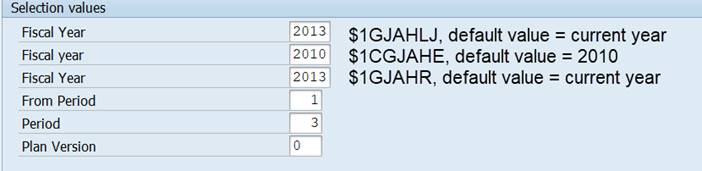
Change the Fiscal year variable as follows:
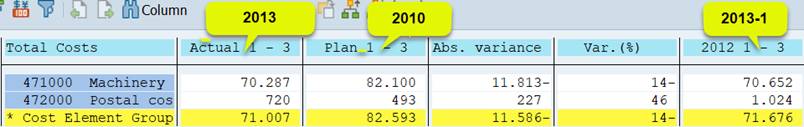
Actual: 1GJAHR, Plan 1CGJAHE, Previous year 1GJAHVJ.
Run the report. The Fiscal year appears three times in the selection.
Change the definition as follows:
Actual 1GJAHR, Plan 1GJAHR, Previous year 1GJAHVJ.
Run the report.
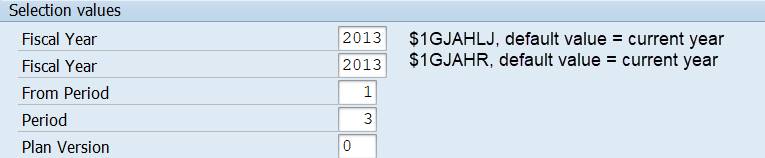
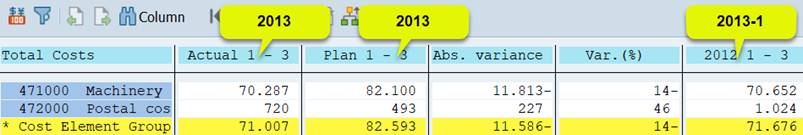
Why do we still get two Fiscal Years? The cause is variable 1GJAHVJ that we used for Previous year. It is derived from the current year variable 1GJAHLJ, which is displayed in the selection.
If you use in the report figures for previous years, use 1GJAHLJ for current year. Variables 1GJAHVJ and 1GJAHVV are derived from 1GJAHLJ.
1GJAHVJ = 1GJAHLJ-1, 1GJAHVV= 1GJAHLJ -2.
You can avoid the problem of multiple selection fields caused by inconsistent variables, if you can move the characteristics to general data selection. We did this with the characteristics Period. However, you need to keep the Fiscal Year in column definition, because it is not same for all columns.
2.11 Add and delete columns
2.11.1 Delete a Column
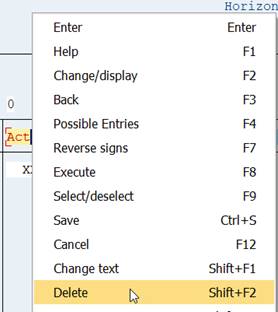
If you need to delete a column from the definition, right-click on the column and select Delete from the menu.
2.11.2 Insert a Column
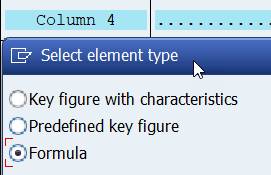
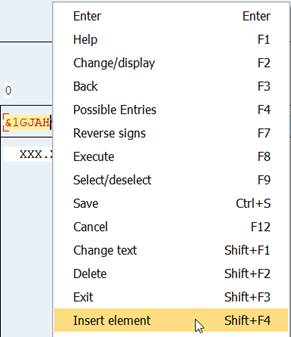
If you need to a column between existing columns, click inside the column before which you want to add the new column. Right-click to open the menu. Select Insert element. Select element type.
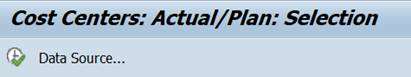
2.12 Report title
You might wonder where you can change the “: Selection” displayed at the beginning of the report.
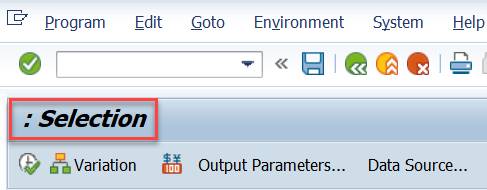
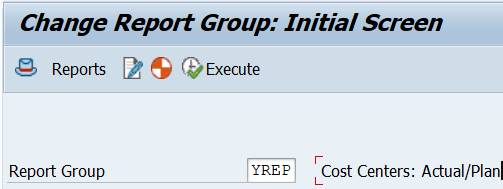
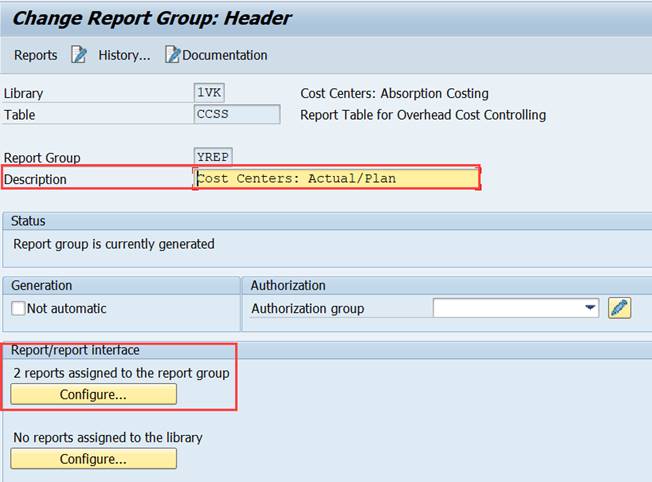
You do it in the Report Group (GR52). Enter there the text you want to see in ‘Description’.
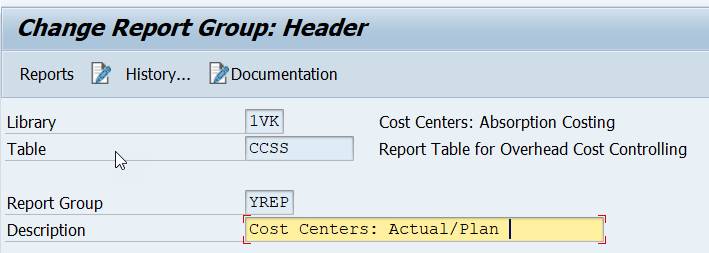
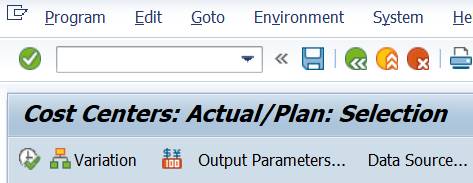
The description text is added before ”: Selection” .
2.13 Report / report interface
In the SAP standard reports we can drilldown to line items and original documents. How do we get this functionality to our own reports? This is also done in the Report Group.
2.13.1 Drilldown to line item reports
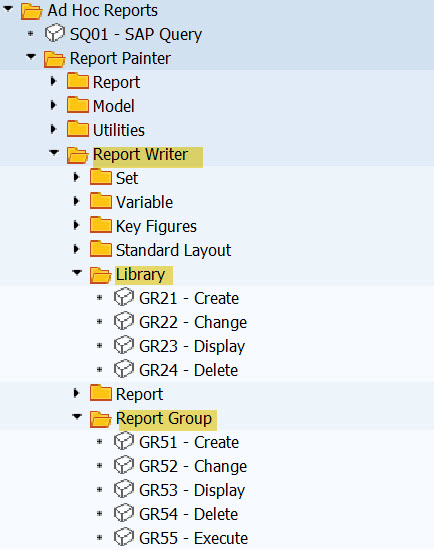
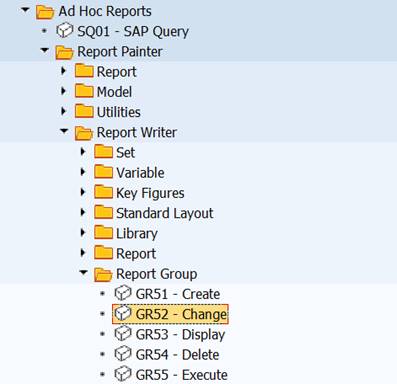
You find Reports Groups in Ad Hoc reports under Report Writer. SAP Menu: Information Systems / Ad hoc Reports/ Report Writer/Report Group
Our report group was YREP.
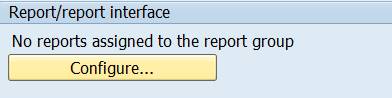
The drilldown feature is called Report/Report Interface. It can be defined at Library or Report Group level.
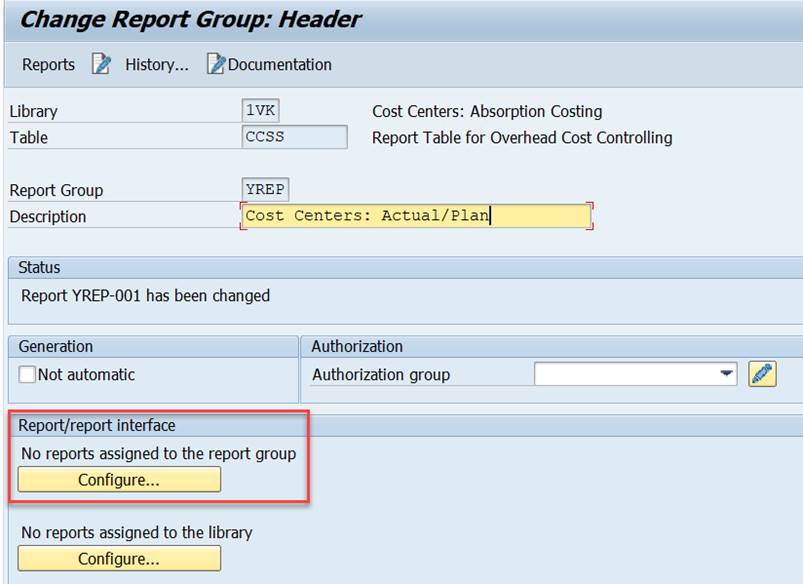
Click on Configure.
To add a report definition, click on Plus.
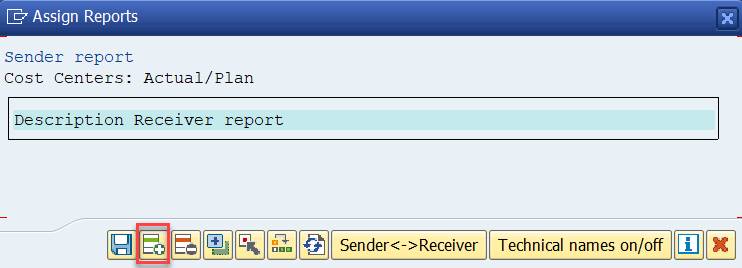
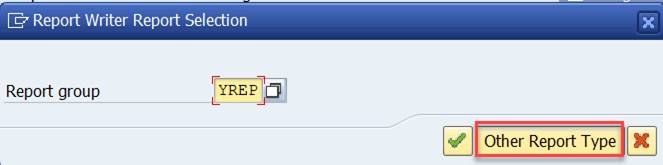
Enter the name of the Report Group. Our group was YREP. Select ‘Other Report Type’.
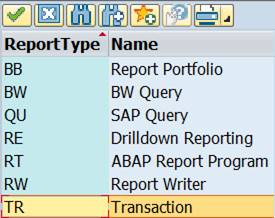
Select Report type TR Transaction.
Check in the SAP menu, which are the transactions for Cost Center line item reports. 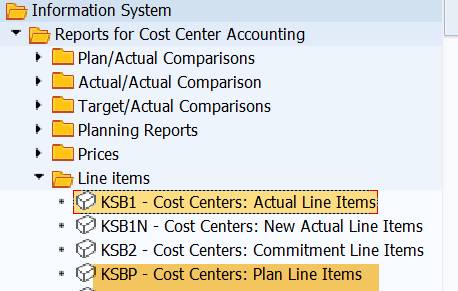
Return to Report Group and add transaction code KSB1 Actual line items.
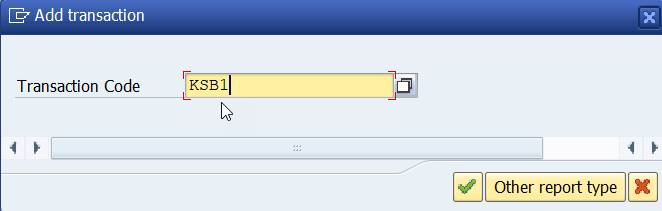
When you return back to Assign Report, click on Plus to add the Plan line items report. Enter the report group YREP, select Other Report Type and TR. Enter the transaction KSBP Plan line items.
You can change the order of the reports, if you want.
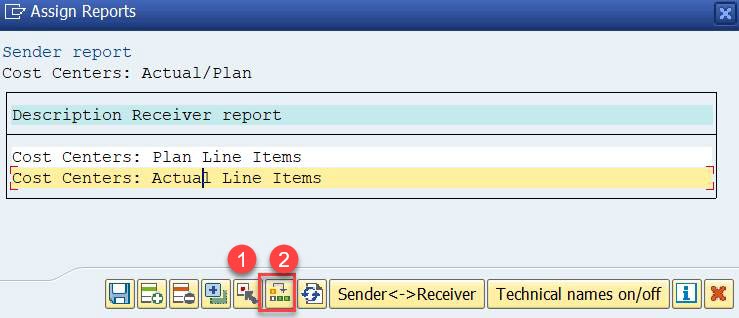
Select (1) first Actual line items, place then the cursor on Plan Line items and click on Move (2).
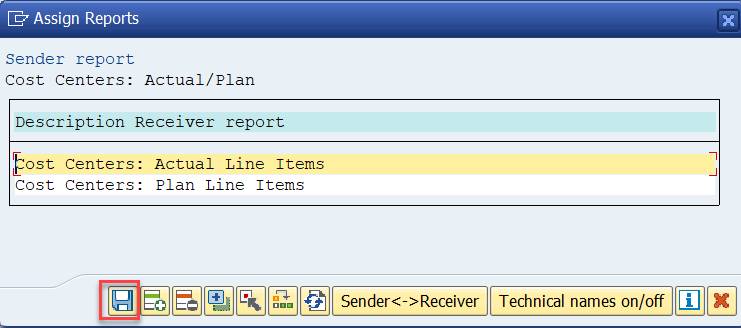
Save the definition.
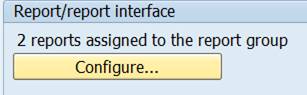
There are now two reports assigned to the report group.
Test run your report. Double-click a figure in actual column.
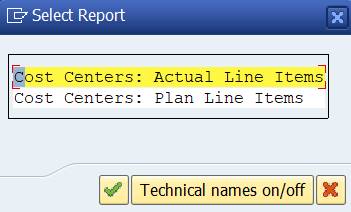
A report selection box opens. Select Actual line items.
You come to the Actual line items report.
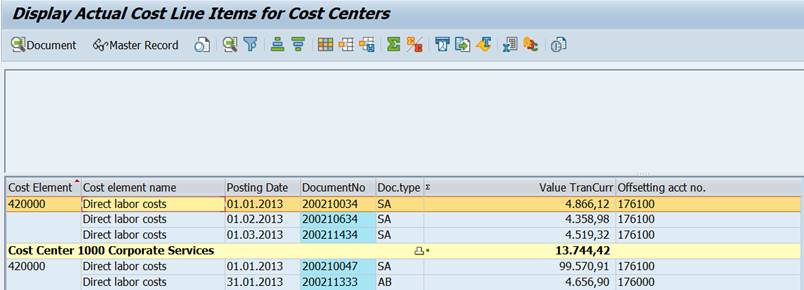
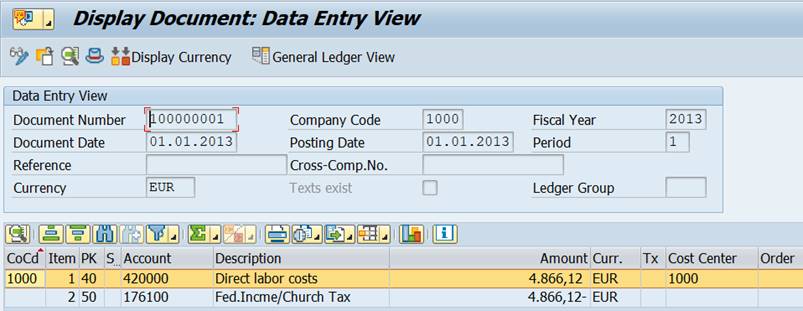
Here you can choose a line, double-click it and move over to the original document. In this example to the accounting document.
Return to your cost center report with the green arrow.
2.14 Report Layout
Next we will take a quick look at the report layout.
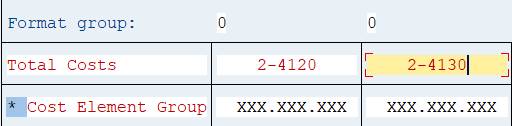
2.14.1 Format Group
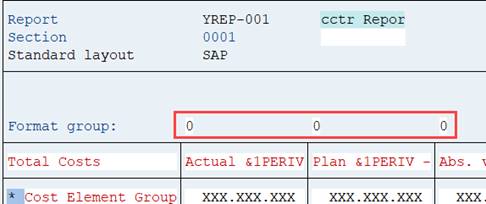
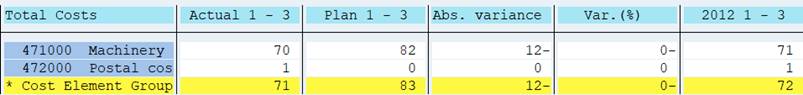
Above every column you can see a format group (0).
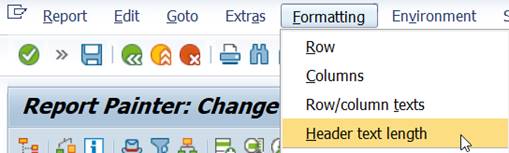
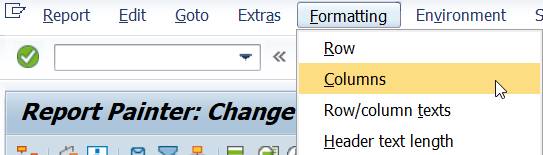
You find the format settings from menu Formatting/Columns.
The format groups controls: the column width, scaling 1-1.000.000, decimals 0 – 0,00000 etc.
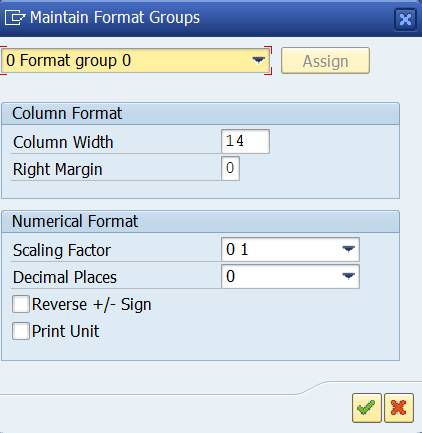
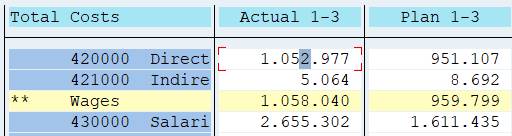
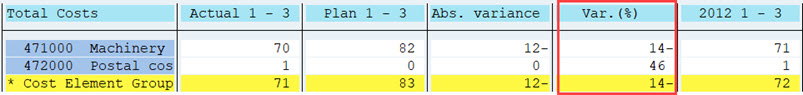
Change the scaling to thousands.
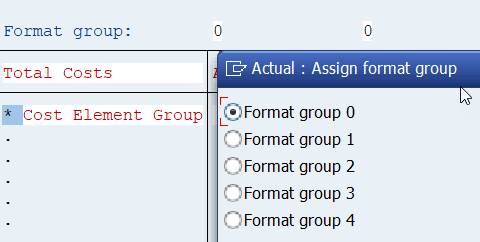
This setting is not a very good for column 4 Var (%). We can change the format group for this column. Double-click on the format group 0 above the column. Assign format group 1 for this column.
Change the scaling in group 1 to 0, with no decimals and check the outcome.
2.14.2 Report Layout
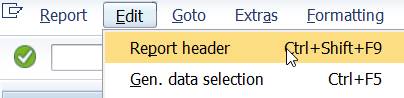
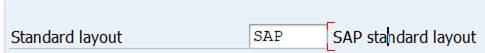
Select Report Header from menu Edit
SAP standard layout is the default setting.
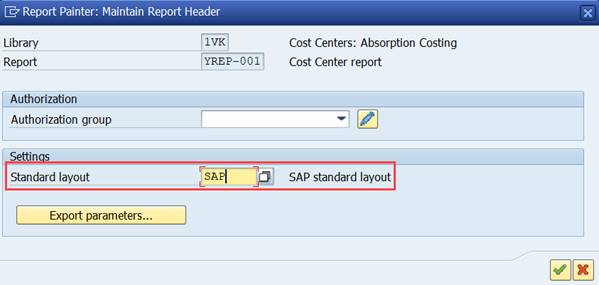
SAP standard layout is the default, but you can also define your own layout and set it as standard layout.
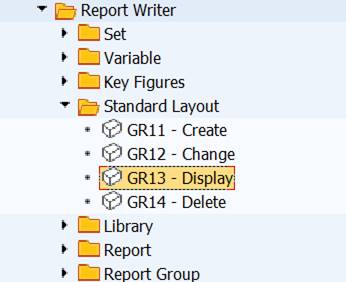
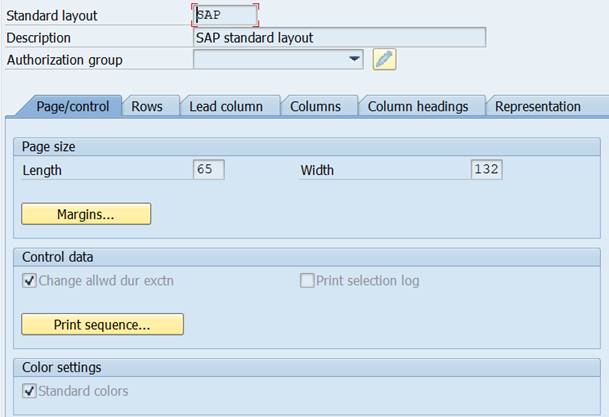
Use transaction GR11 to create own layouts.
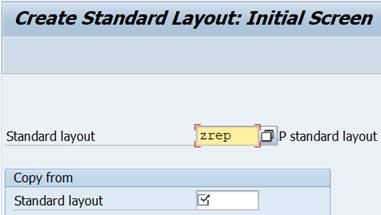
Copy the new layout from existing standard layout and make the changes you want.
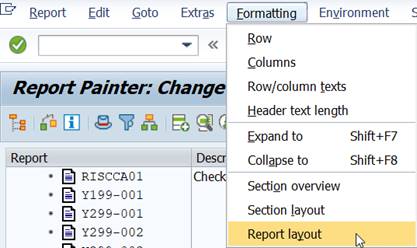
The Report layout is in menu Formatting/Report Layout.
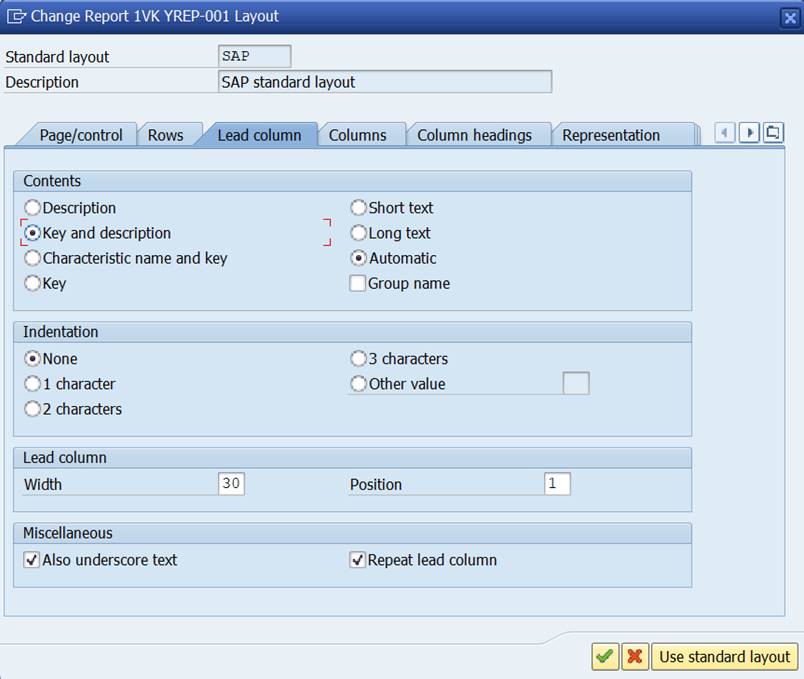
If you run the report in Expert Mode, you can change the Layout settings under Settings/Report Layout.
2.15 Sections
2.15.1 Create New section
You can use sections in your reports.
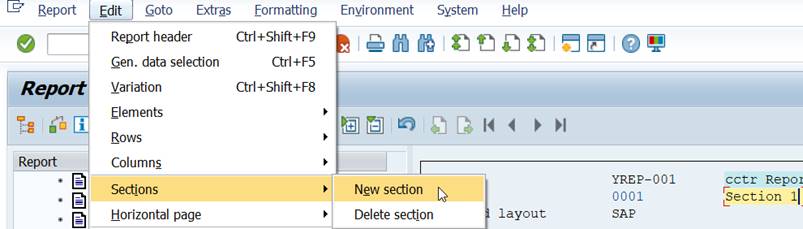
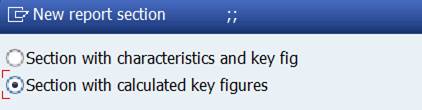
First you define the type of the section.
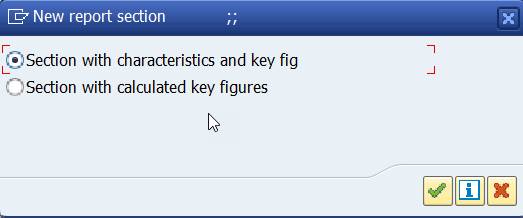
2.15.1.1 Section with characteristics and key figures
The definition of Sections with characteristics and key figures is the same as for columns. You can present statistical postings, statistical key figures, acticity types, quantieties in report sections.
SAP Help: “If cost centers, orders and project wbs are needed together, they are usually in separate sections of the report. The cost cost center is repeated in each sections lead column.”
As you already know how define Report Painter rows and columns, I will not repeat it here.
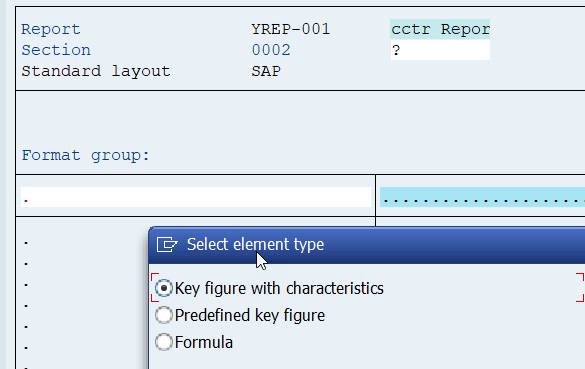
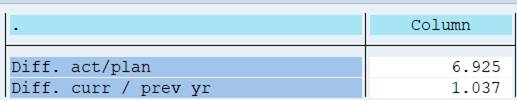
2.15.1.2 Section with calculated key figures
Here you can present all kind of key figures. In our report we had in columns 3 and 4 the difference between Actual and Plan. We could present them as calculated Key figures.
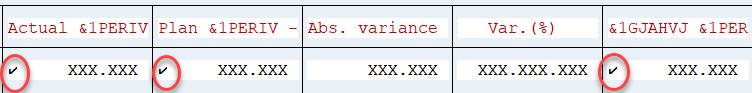
Before you start with the section definition, you need to define cells that you use in the key figures. Double click the intersection of row and column. A check mark is added. It indicates the cells you can use in calculations.
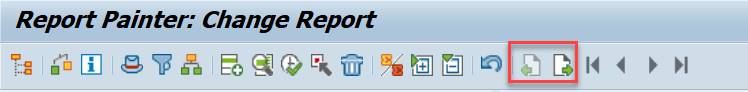
Move to the section with section buttons.
Enter the header texts.
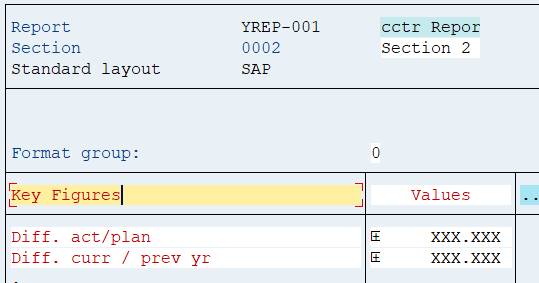
Double-click on the first row the lead columns and add the name of the first key figure. Repeat for the next key figure. In the adjacent column + xxx.xxx is added. It is a placeholder for the formulas.
Double-click on the placeholders. The formula editor opens. The cells defined are already there. Write the formula to the formula line.
Save and test run the report.
3 Main elements of Report Painter
The main elements of Report Painter reports are:
· Reporting tables
· Report Libraries /
· Report Group
We have already encountered them, when creating our report.
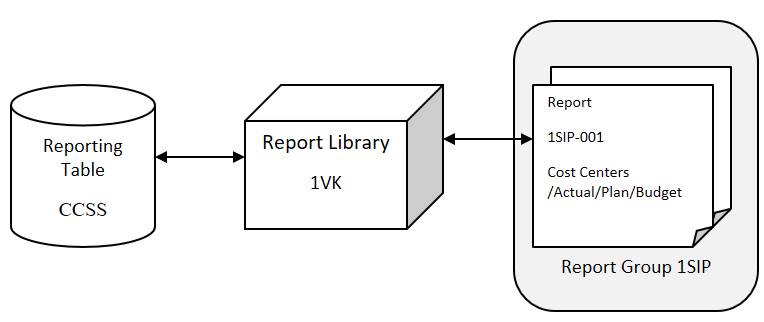
3.1 Library 1VK and Report Table CCSS
Let’s take a closer look at library 1VK (tx. GR23)
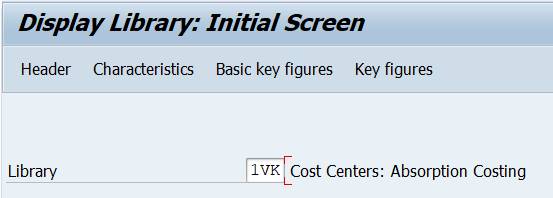
1VK Most Standard Cost Center reports are in here
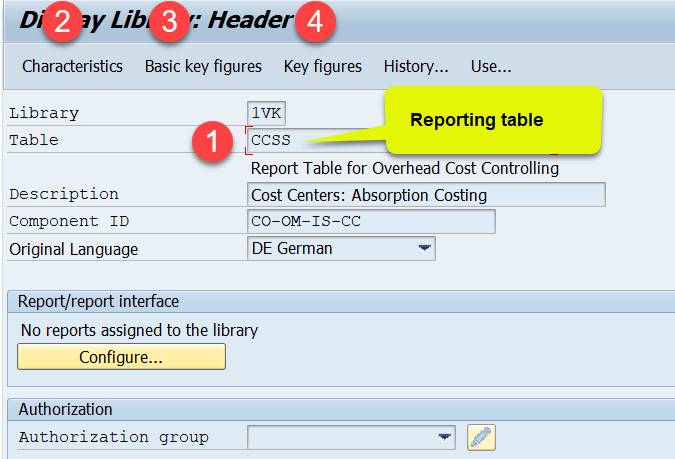
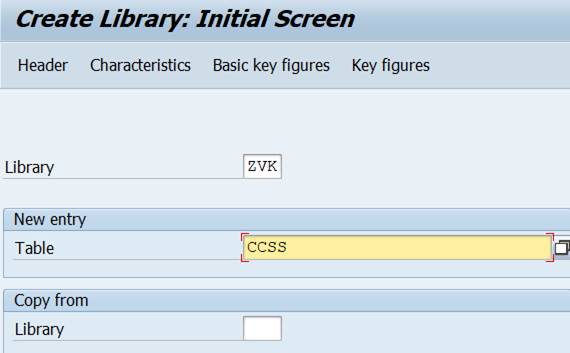
The keystone of the library is a reporting table (1) that provides the characteristics and key figures you can use in reports. Library 1VK uses table CCSS. If you create your own library, the first thing to do is to choose a reporting table.
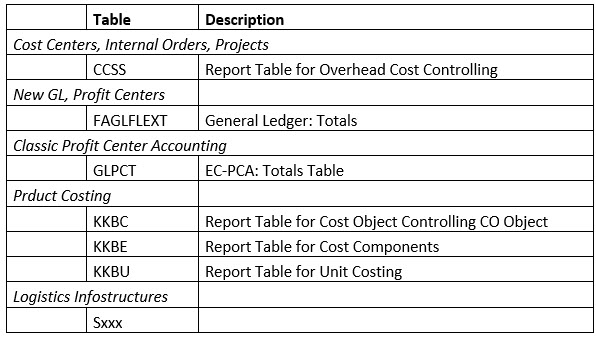
Below some of the most commonly used reporting tables.
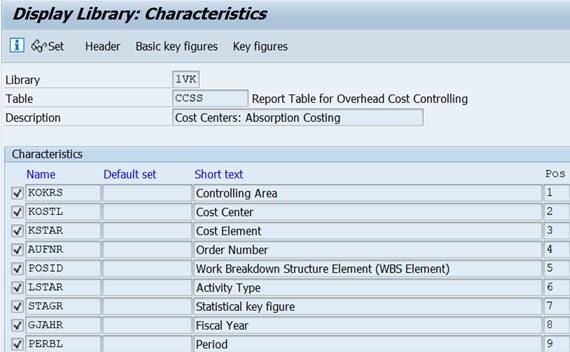
3.1.1 Characteristics
Characteristics (2) are elements you will use in the report rows, columns and selections. Such as cost center, cost element, profit center, account.
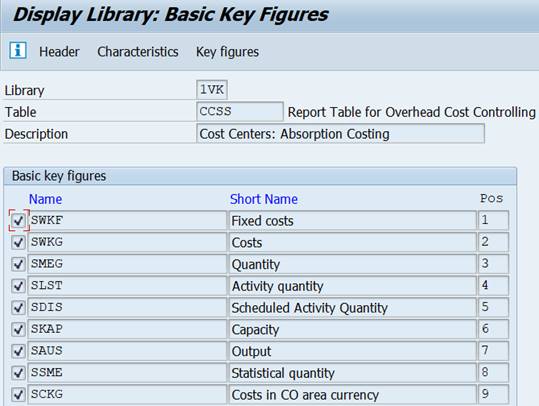
3.1.2 Basic Key Figures
Basic Key Figures (3) are numerical value fields. Such as costs, quantity, Total costs in trans. or object currency.
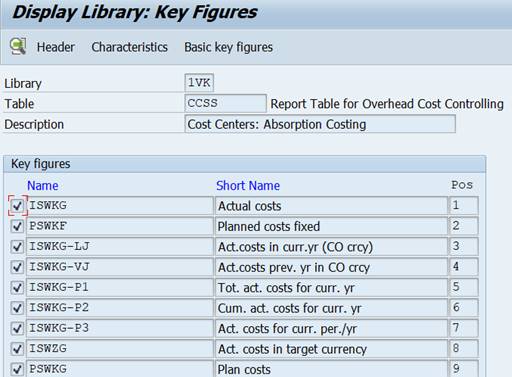
3.1.3 Key figures (predefined key figures)
Predefined key figures (4) combine key figures and characteristics. Examples of key figures: actual costs in current year, plan costs in closed year.
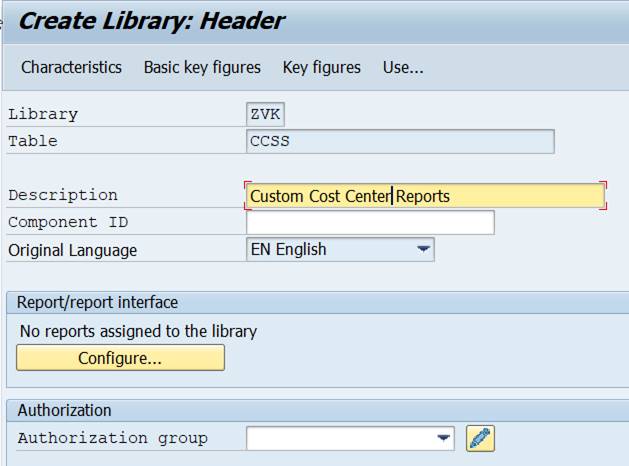
3.2 create your own library
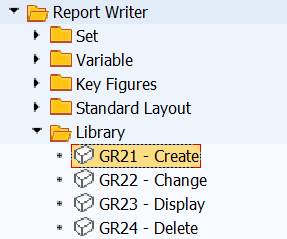
Start the names of your own libraries with Y or Z.
3.3 Report Group YREP
A Report Painter report contains only the report definition. Everything else is in the Report Group. When you run a new report for the first time, the system checks the Report Group assignment. If the report is not in any Report Group, you can either choose an existing Report Group or let the system create a new group.
The system executes all the reports in the Report Group at the same time. Usually there is only one report, but there can be several, e.g. month end reports. You can assign a report to several Report Groups.
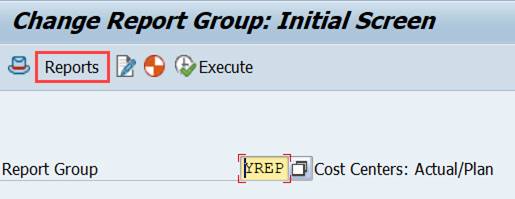
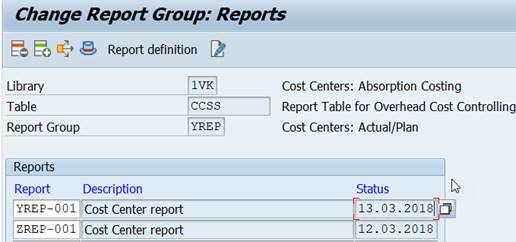
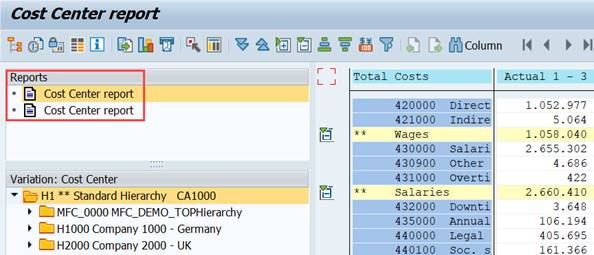
If the report group contains several reports these can be executed as a set. For example you have two reports in report group YREP.
Start the reports from the report group.
Both reports show up on the report screen, where you can start them.
In the report group header you entered the description that shows up in the report selection screen.
The drilldown to line items was defined in the Report/Report interface of the Report Group.
3.4 Sets and Variables
We have in our definitions used different sets and variables.
All the cost element, cost center, order, profit center groups are sets that you can use in the report definitions.
For cost elements and cost centers we used Set variables.
Variables are in Report Writer menu.
Set variable 1KSTAR contains all cost elements. Set variable 1KOSET contains all cost centers.
The use of set variables adds to report selection the possibility to select groups. For example 1KOSET -> Cost Center Group or values(s), 1KSTAR -> Cost Element Group or value(s).
Depending on their definition the variables can get different default values.
We used variables also in the column headings. Before the variable a prefix “&” was added. Numerical variables enable calculations, such as “&CURYEAR – 1”.
You can maintain the variables with transactions GS13 Display, GS12 Change.
Set variable 1KSTAR contains all cost elements. Set variable 1KOSET contains all cost centers.
We explored the use of variables to define Fiscal year and Period.
1GJAHLJ contains a system variable #S001= current year.
Variable 1GJAHVJ contains a formula ‘current year – 1
Variables 1PERIV, 1PERIK define the period interval. The default value of 1PERIV is 1, which you can be change in the report selection.
The variable 1PERIK contains a system variable #S006 = current period.
Use standard variables for the reporting tables, if possible. Table T802G contains the variables per the tables.
What next?
At this stage of the exercise you should have the basic skills necessary to work with your own reports. Keep in mind that there are lot’s of standard reports in the system that you can copy and mofify to suit your own purposes.
How to get the reports to production? That depends on the IT policies of your company. It is possible to create transport requests or export the report definitions as text files to other systems (DEV, PRD). It is possible to generate transactions and attach the reports to report trees (Area Menus).

More on the subject:
SAP Area Menus
How to export/import report groups


